
As part of the Think Water, Think Cedar Key events in spring 2016, a team of researchers from the UF College of Design, Construction and Planning piloted several new techniques for gathering and generating 3-D data of buildings and the terrain, and for using that data to visualize flooding scenarios in Cedar Key. The team used three different types of 3-D data techniques:
- Geographic information systems (GIS)
- Laser scanning
- Physical model
Geographic Information Systems
The GIS technique created a virtual 3-D model of all of Cedar Key using a digital elevation model (for topography), satellite imagery, and the extrusion of building footprints to create three dimensional buildings, as shown below.

3-D GIS model of downtown Cedar Key
Then, possible flooding scenarios from hurricanes and future sea level rise determined in a previous project were visualized by adding a transparent blue layer at a various elevations. The next photo shows one example, which represents a storm surge flooding scenario that could occur during a moderate hurricane.

3-D GIS model with storm surge scenario
Laser Scanning
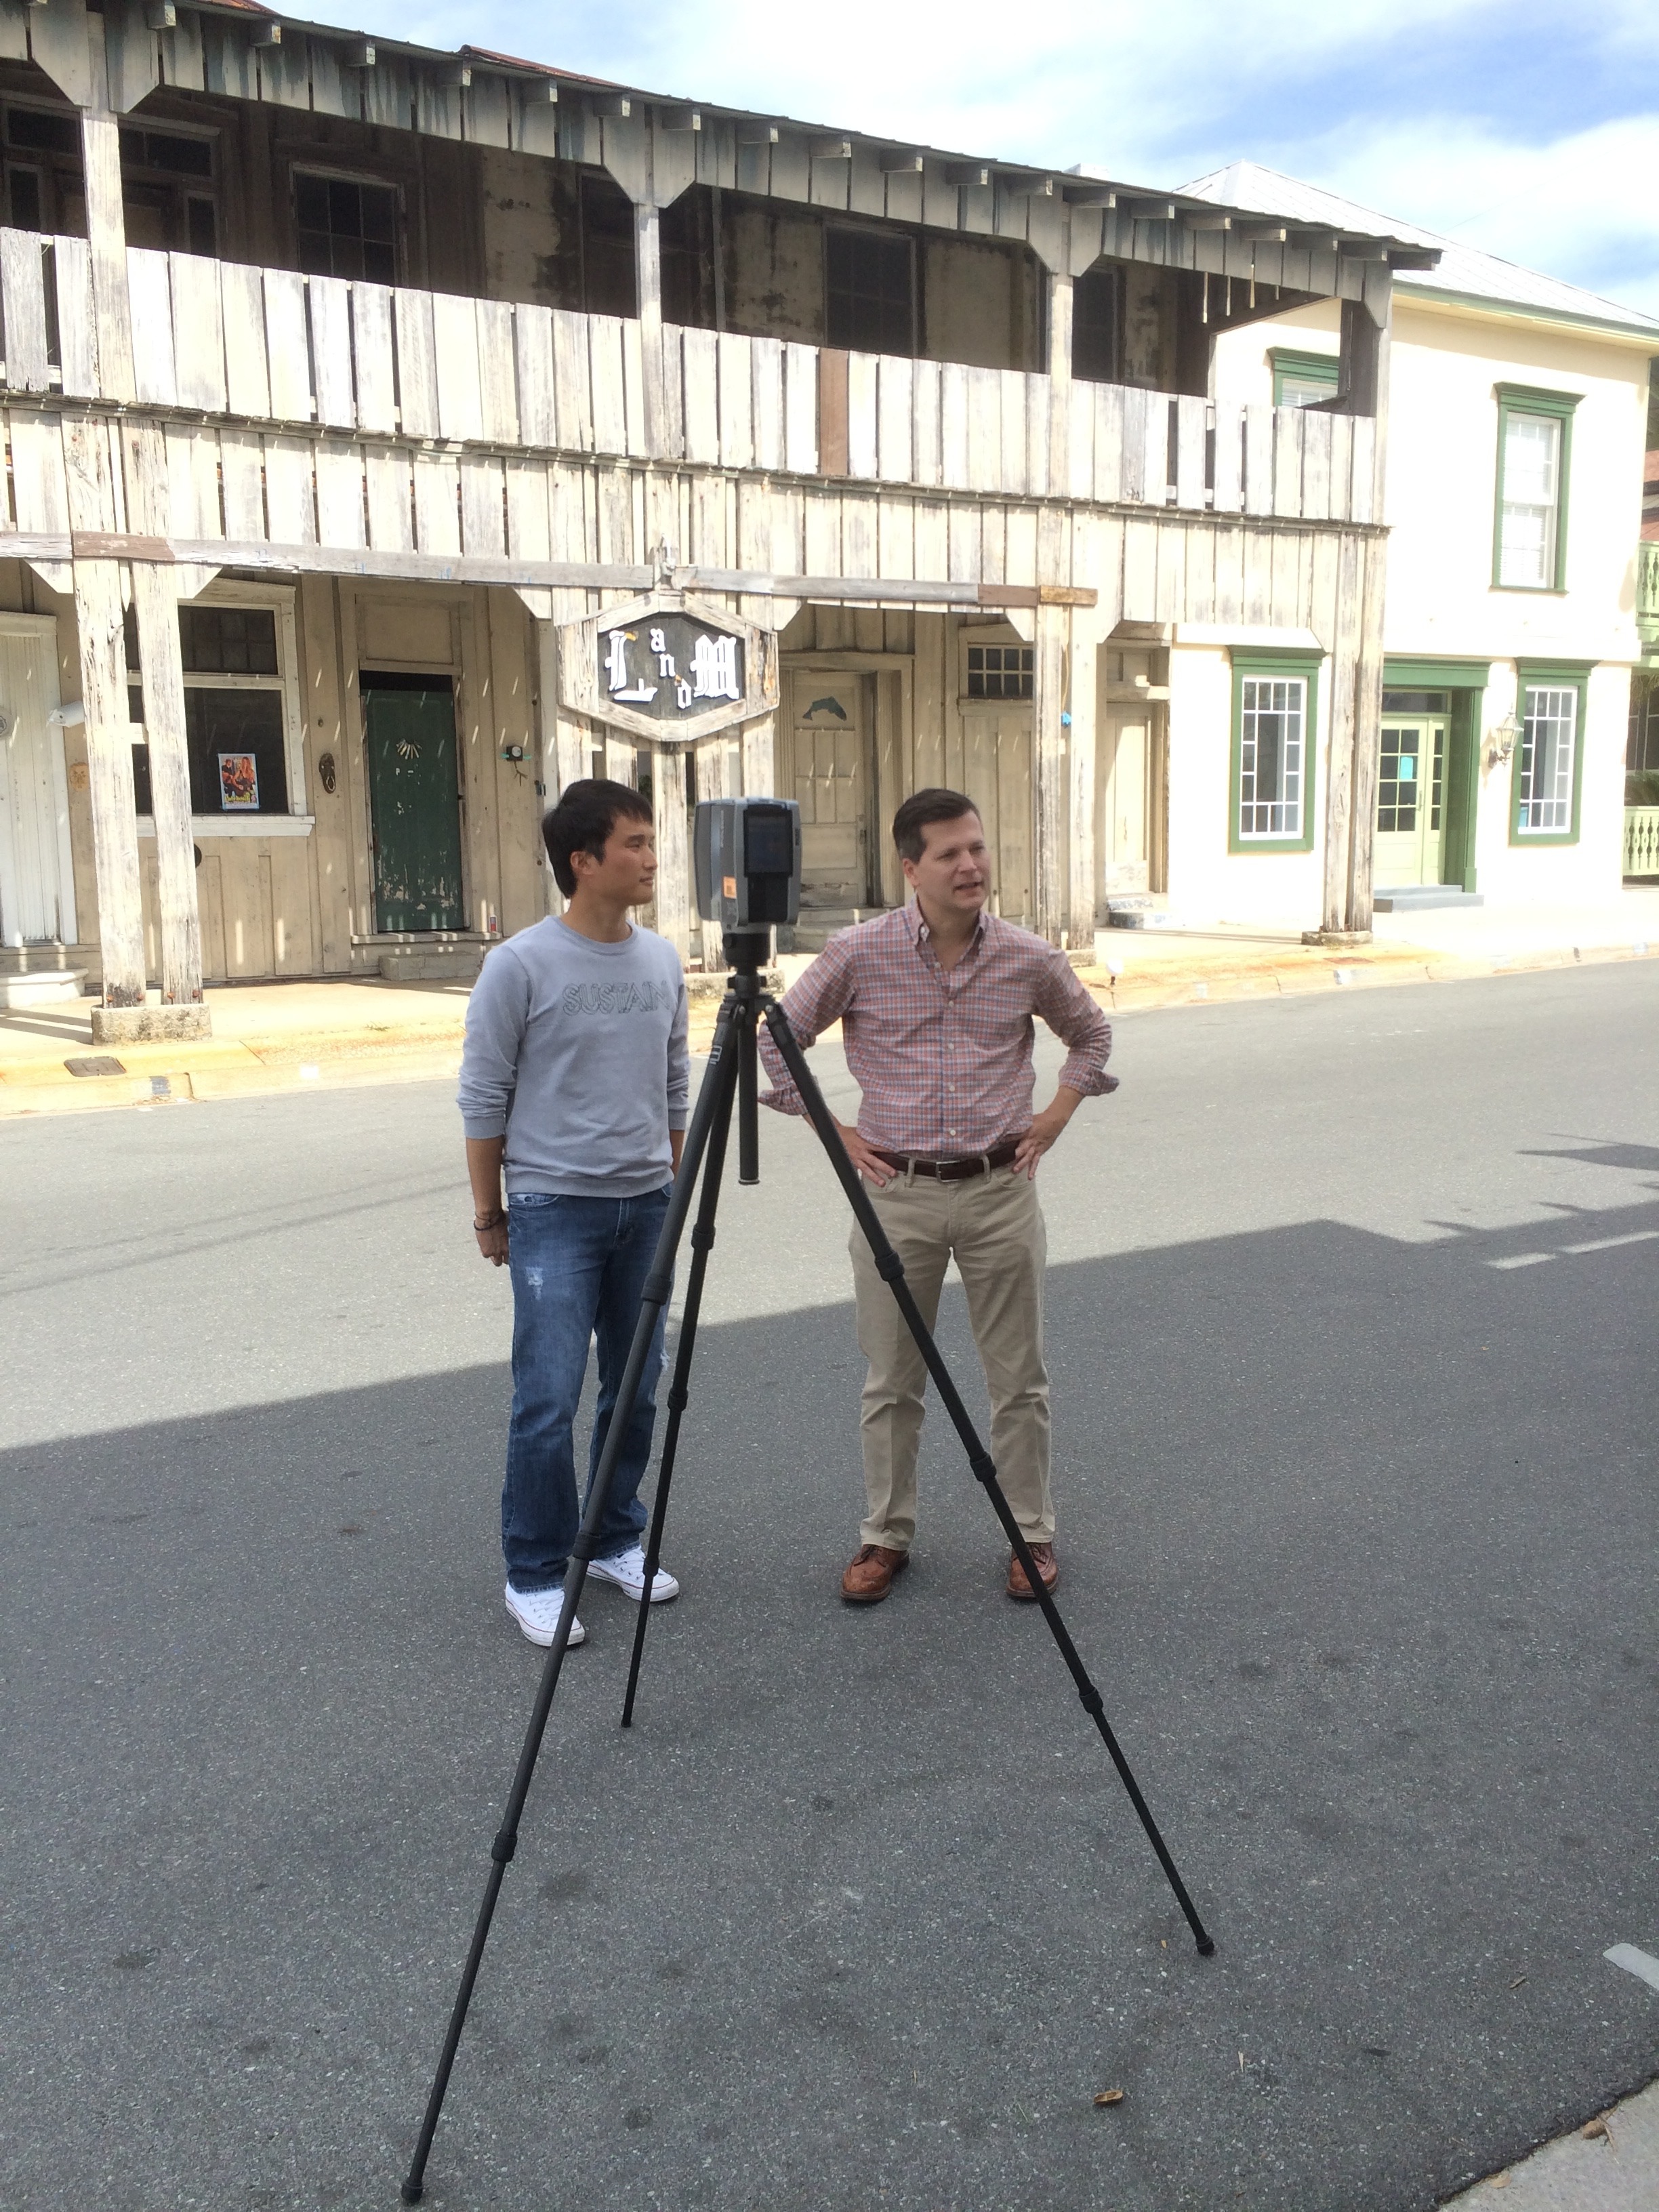
Sujin and Marty laser scanning in Cedar Key
The laser scanning technique gathered new digital data in the field to create a high resolution 3-D virtual model of the buildings, yards, and streets along a three-block section of downtown Cedar Key.
The resulting digital model created a virtual reality accurate to a few millimeters. The researcher could virtually view the data from difference perspectives and add features, such as transparent blue flood waters.

3-D laser scan of the Island Hotel

3-D laser scan of the Island Hotel with flooding visualization
Physical Model
The last technique for visualizing flooding the team piloted was a physical model created from the laser scanning data. The laser scanning produced very accurate elevation readings, which then digitally guided a router at UF’s Fab Lab to carve a large wooden board to model the streetscape. The research team also used the laser scanning data to determine building dimensions and locations, and then made the buildings out of plexiglass and glued them to the board. The model was placed in a large tank borrowed, and fitted with a hose and stand, from the UF/IFAS Cedar Key Field Office. The team filled the tank with water to simulate the flood scenarios, from the lowest up to the highest levels ever seen (over 20 feet).

Physical model on display at Think Water, Think Cedar Key
Putting It Together
The virtual 3D GIS and laser scanning results were combined and animated in a video, which is has been on display at the Cedar Key Chamber office downtown.
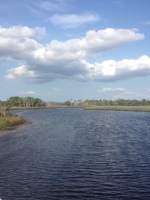
Several months after creating the visualizations, physical model, and video, Hurricane Hermine struck Cedar Key, in August 2016. The pattern of storm surge during Hermine was similar to that modeled.

Downtown Cedar Key during Hurricane Hermine, photo courtesy of Sue Colson
UF Research Team
Marty Hylton, Director, Historic Preservation Program
Ilir Bejleri, Associate Professor, Urban and Regional Planning
Kathryn Frank, Assistant Professor, Urban and Regional Planning
Sujin Kim, Doctoral Student, Historic Preservation
Zongni Zu, Doctoral Student, Urban and Regional Planning
Luiz Ungerecht, Doctoral Student, Urban and Regional Planning
Project Sponsors
City of Cedar Key
Florida Humanities Council
Cedar Key News
Florida Sea Grant


Very interesting post, I am doing a project on flood studies and analysis, this helps a lot!
Very interesting, the flood modeling is very insightful!
Wow, deploying 3D visualizations in flood modeling would surely help the engineers plan better infrastructure. Great work!